This is customized using a template notation. here how to customize the CSS simple (http://qiita.com/items/fae3937363d1bb1b8090) * japanese please see.
<script>

ccchart.base('white');

var data1 = [
    ["Month",1,2,3,4,5,6,7,8],
    ["Oolong",20,23,12,20,42,50,43,56],
    ["Coffee",52,50,44,50,60,55,68,80]
];

var data2 = [
    ["Month",1,2,3,4,5,6,7,8],
    ["Oolong",80,150,120,120,100,80,100,140],
    ["Coffee",100,120,150,260,180,150,170,220]
];

var data3 = mkPercentArry(data1, data2);

function mkPercentArry(molecular, denominator){
  var header = molecular[0];
  var body1 = molecular.slice(1);
  var body2 = denominator.slice(1);
  var percentAry = [];
  var percent = 0;

  percentAry.push(header);
  for(var row = 0; row < body1.length   ; row++){
    percentAry_wk = [];
    percentAry_wk.push(body1[row][0])
    for(var col = 1; col < body1[row].length  ; col++){
      percent = Math.round(body1[row][col] * 100/body2[row][col] );
      percentAry_wk.push(percent);
    }
    percentAry.push(percentAry_wk);
  }
  return percentAry;
}
</script>
<canvas id="hoge0-3"></canvas>
<script>

var conf = {
    "title": "default tooltip",
    "type": "bar",
    "width": 500,
    "height": 380,
    "minY": 0,
    "maxY": 100,
    "useToolTip": "yes",
    "useVal": "yes"
};


ccchart
  .base('white')
  .init('hoge0-3', {
    "config": conf,
    "data": data1
  })
</script>
<canvas id="hoge0-4"></canvas>
<script>
var conf = {
"title": "customized tooltip",
"unit": {
"unit": "%",
"left": 15,
"top": 60,
"align": "left",
"color": "#888",
"font": "100 12px 'Arial'"
},
"type": "bar",
"width": 500,
"height": 380,
"minY": 0,
"maxY": 100,
"useToolTip": "yes",
"cssTooltip": {
"width": "280px",
"border": "1px solid rgba(180,180,180,0.7)",
"background-color": "rgba(180,180,180,0.3)",
"font-size": "18px",
"line-height": "11px",
"padding": "12px",
"text-align": "center",
"text-shadow": "0px"
},
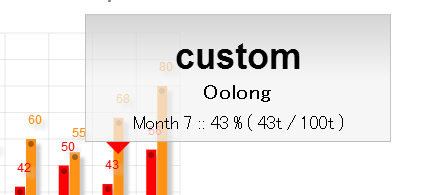
"tmpToolTip": ""
+ "<h1 style='padding-top:0px;'>custom</h1><h3>{{rowName}}</h3>"
+ "{{colNamesTitle}}{{colName}} :: {{data3}} % ( {{data}}t / {{data2}}t )",
"useVal": "yes"
};
ccchart
.init('hoge0-4', {
"config": conf,
"data": data1
})
</script>
 "cssTooltip":  {
      "width": "280px",
      "border": "1px solid rgba(180,180,180,0.7)",
      "background-color": "rgba(180,180,180,0.3)",
      "font-size": "18px",
      "line-height": "11px",
      "padding": "12px",
      "text-align": "center",
      "text-shadow": "0px"
    }
"tmpToolTip": ""
        + "<h1 style='padding-top:0px;'>custom</h1><h3>{{rowName}}</h3>"
        + "{{colNamesTitle}}{{colName}} :: {{data3}} % ( {{data}}t / {{data2}}t )"